One crystal, three channels.
Erbium gives off blue, green and red light together. Each color is recorded on its own, so a single reading carries three signals, not one.
Measurements from the IMS lab in Princeton. One erbium-doped crystal, gadolinium oxysulfide (Gd₂O₂S:Er 6%), is driven by a bank of near-infrared laser diodes whose power and timing we program channel by channel. We record the blue, green and red light it gives back, millisecond by millisecond.
Every measurement on this page comes from this setup. The controller can hold each laser steady or drive it with any waveform, so the crystal can be questioned with almost any mix of infrared light.
Each run blends seven near-infrared lasers in a set proportion, shown by the bars, and records blue, green and red emission at the same time. Choose a pulse length.
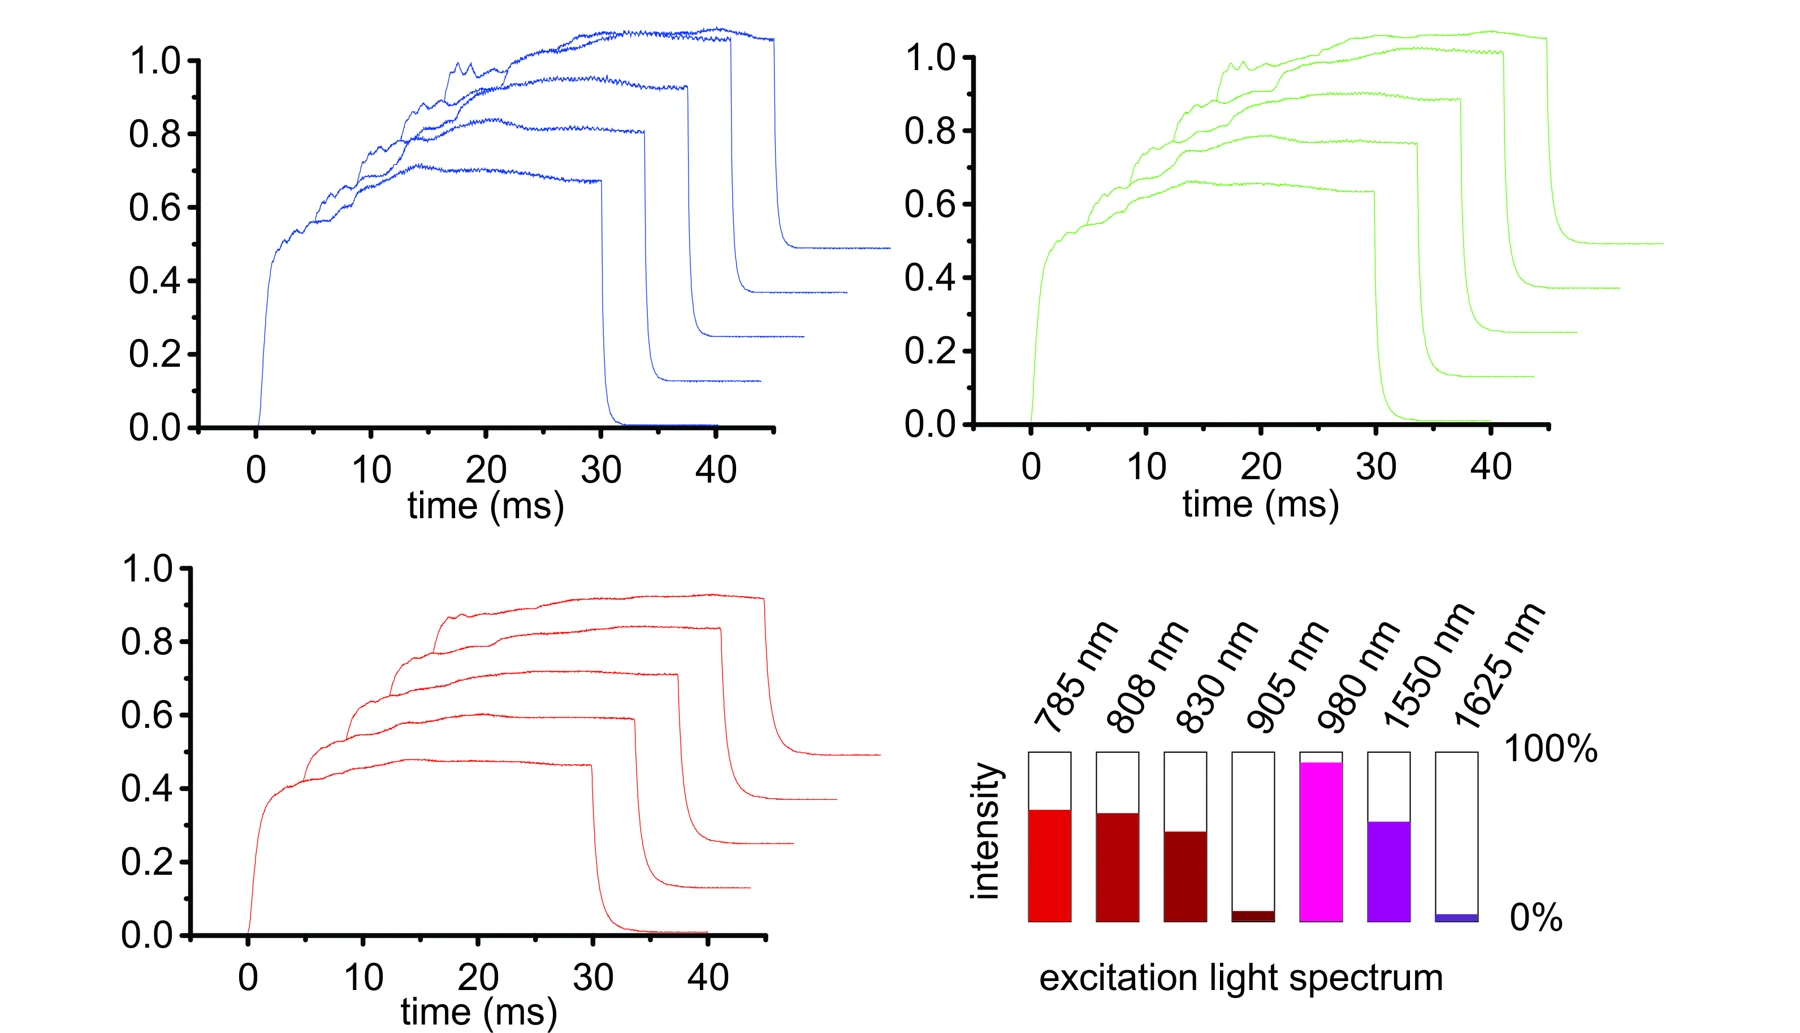
Each laser mix is held for 30 ms, so you can see the light build up over the first milliseconds and fade after the lasers switch off.
Vertical axis: normalized luminescence. Successive traces are offset in time and height so they can be compared side by side. Bars: relative intensity of each laser (785, 808, 830, 905, 980, 1550, 1625 nm) in that run.
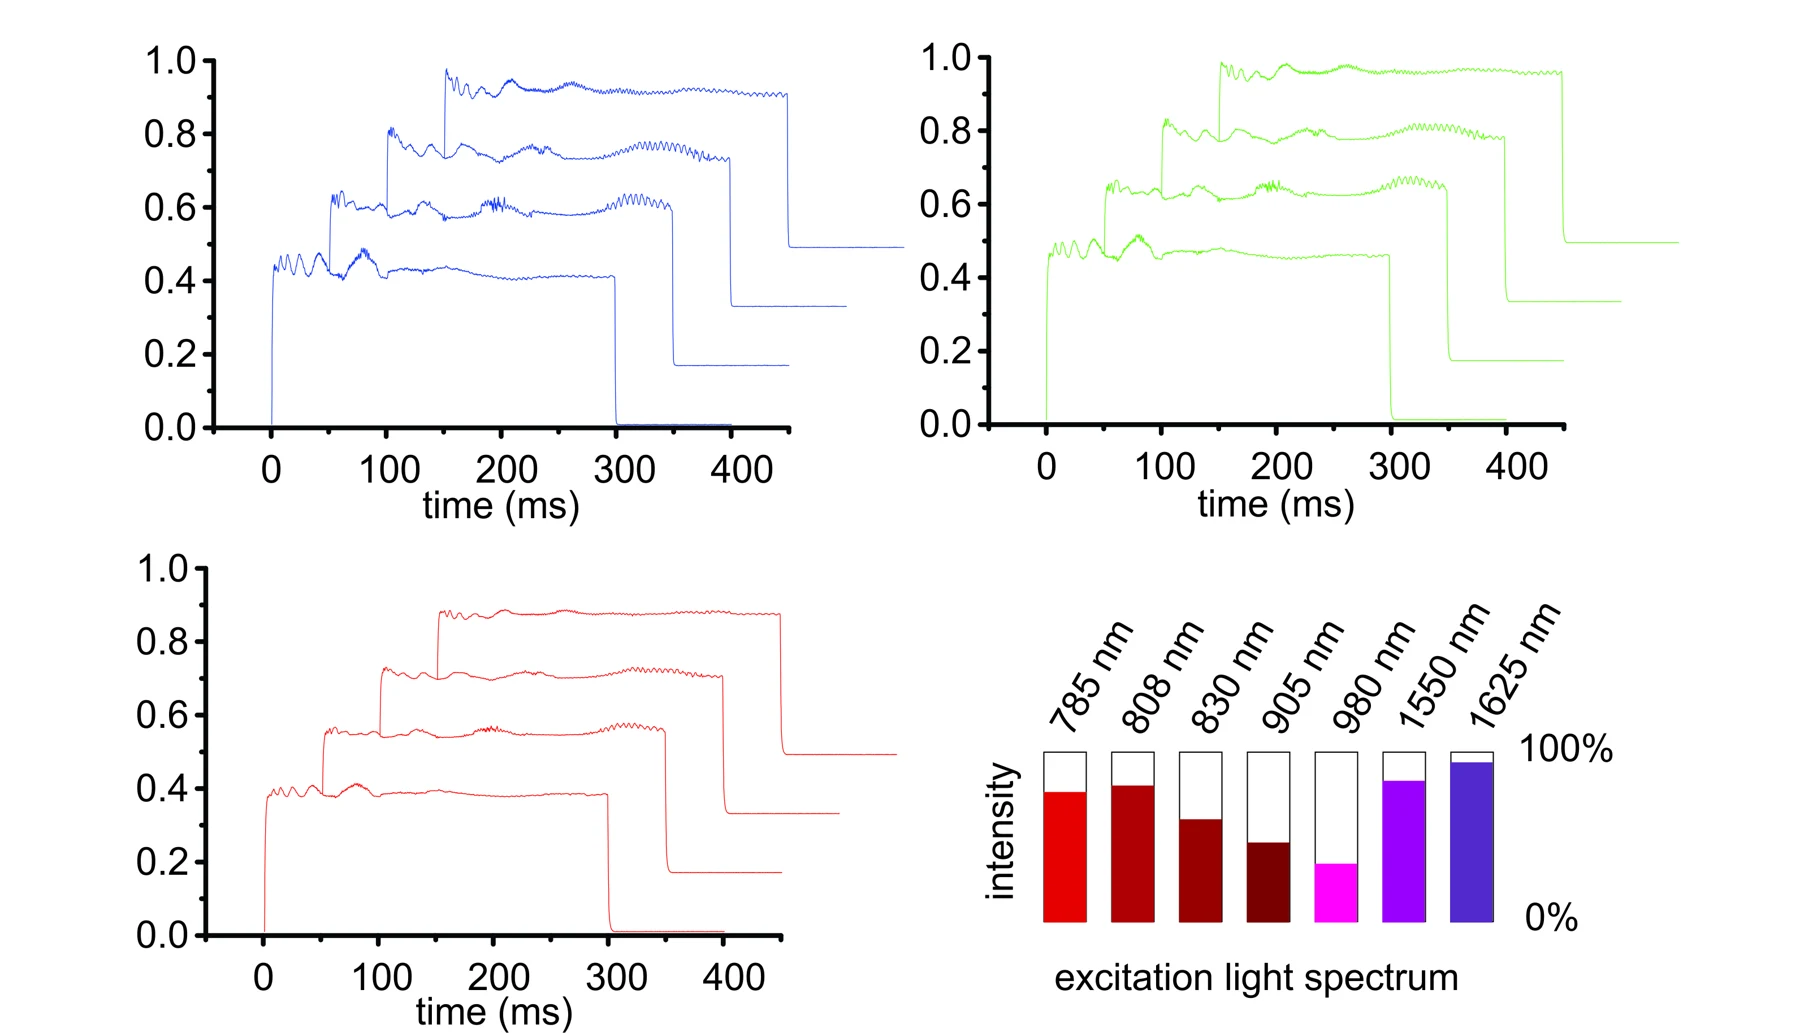
Held ten times longer. The emission settles to a steady level within a few milliseconds and holds for the whole pulse.
Vertical axis: normalized luminescence. Successive traces are offset in time and height so they can be compared side by side. Bars: relative intensity of each laser (785, 808, 830, 905, 980, 1550, 1625 nm) in that run.
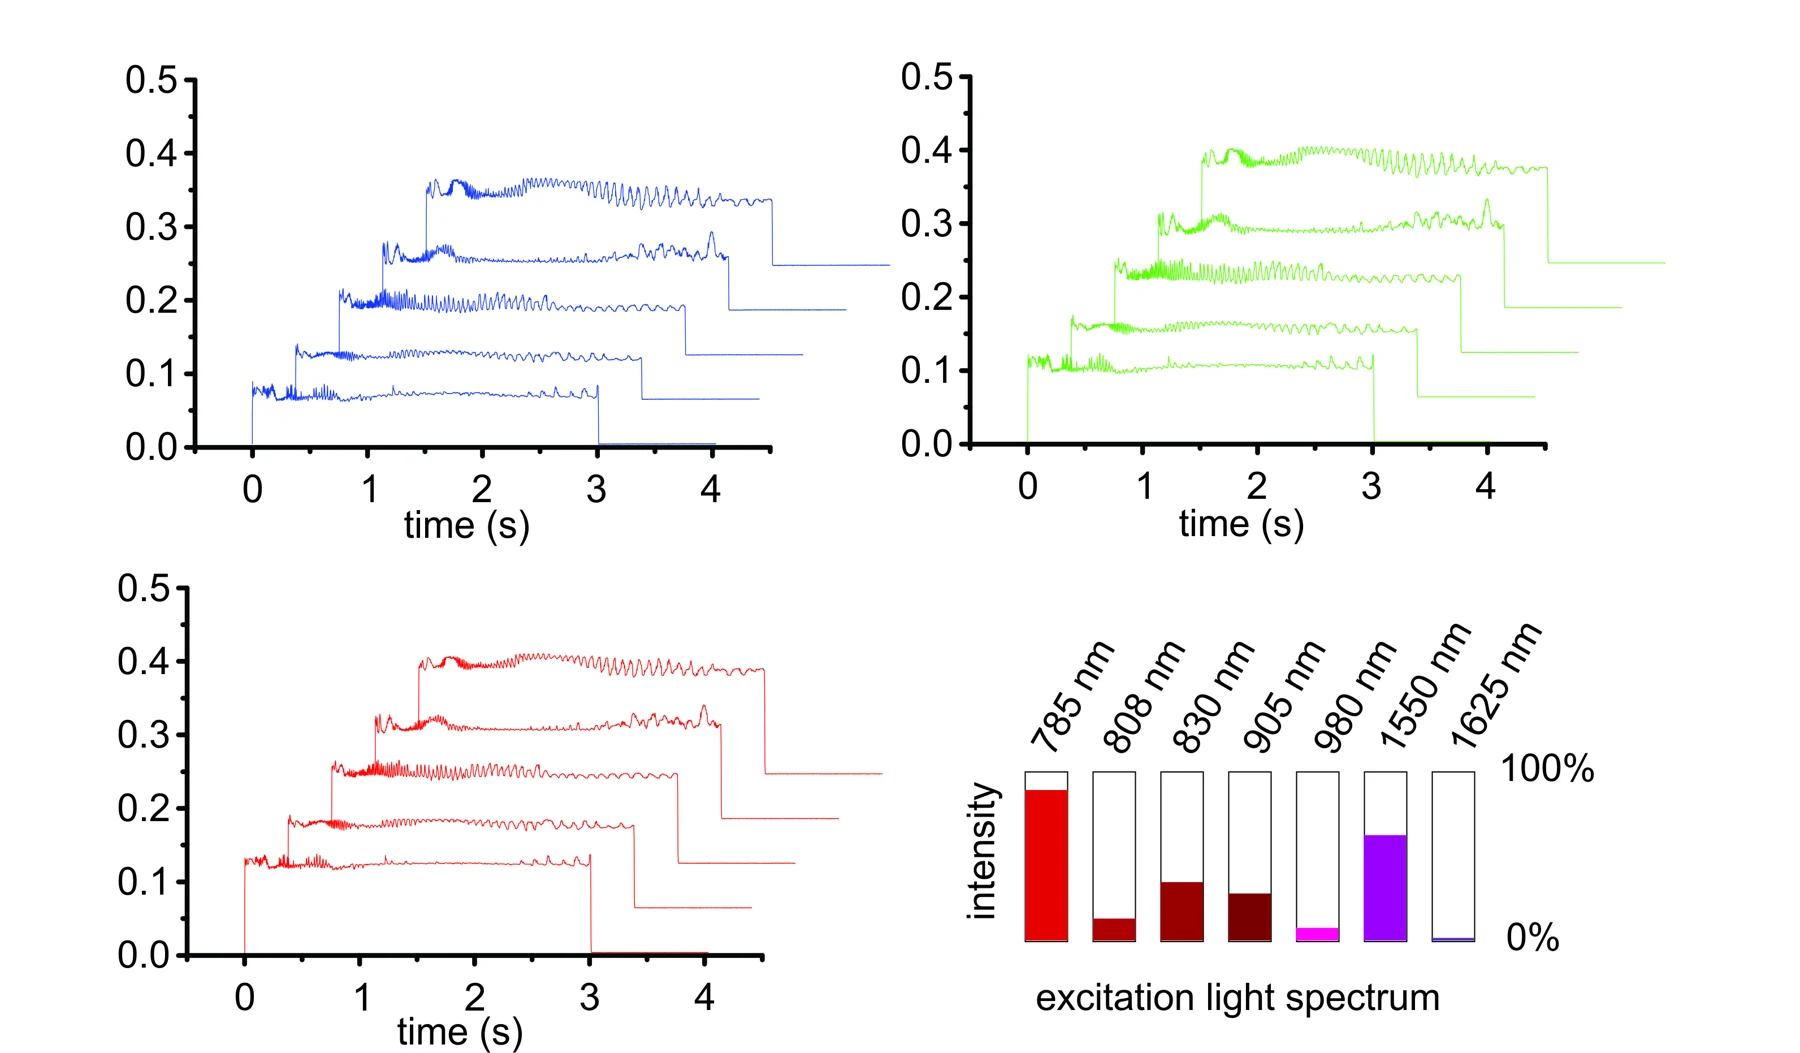
Held for three seconds with a different laser mix. The output stays flat for seconds at a time: a steady, repeatable signal.
Vertical axis: normalized luminescence. Successive traces are offset in time and height so they can be compared side by side. Bars: relative intensity of each laser (785, 808, 830, 905, 980, 1550, 1625 nm) in that run.
Erbium gives off blue, green and red light together. Each color is recorded on its own, so a single reading carries three signals, not one.
Each run uses a different blend of lasers. Which wavelengths, how strong and for how long are all choices the reader makes, and the crystal's answer depends on all three.
The 30 ms traces show how the light builds and fades. IMS readers use timing as well as color; see U.S. Patent 11,922,265 on temporal authentication.
Each surface follows green emission (arbitrary units) through a 60 ms window while the laser-diode drive current is stepped from 50 to 260 mA. Same crystal, three excitation wavelengths, plus an 808 nm control. The blue and red surfaces look similar. Click any panel to enlarge.
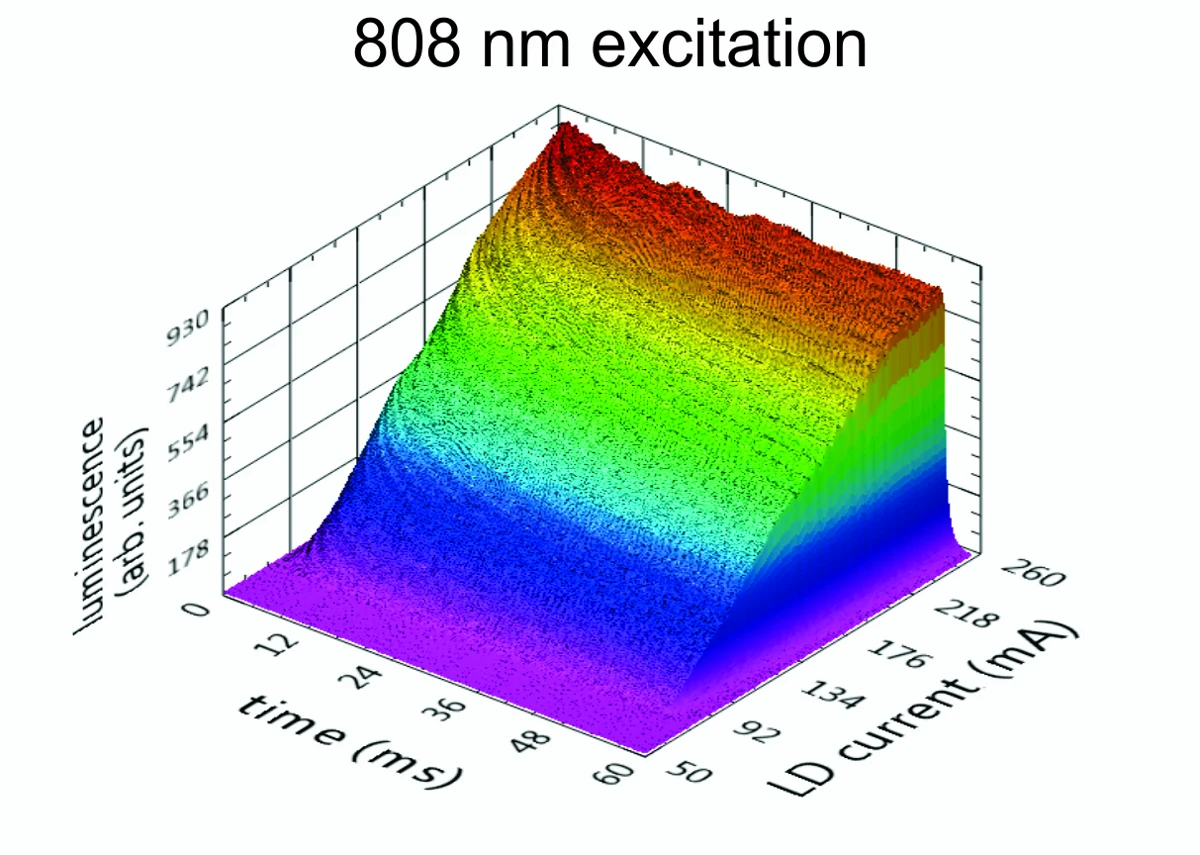
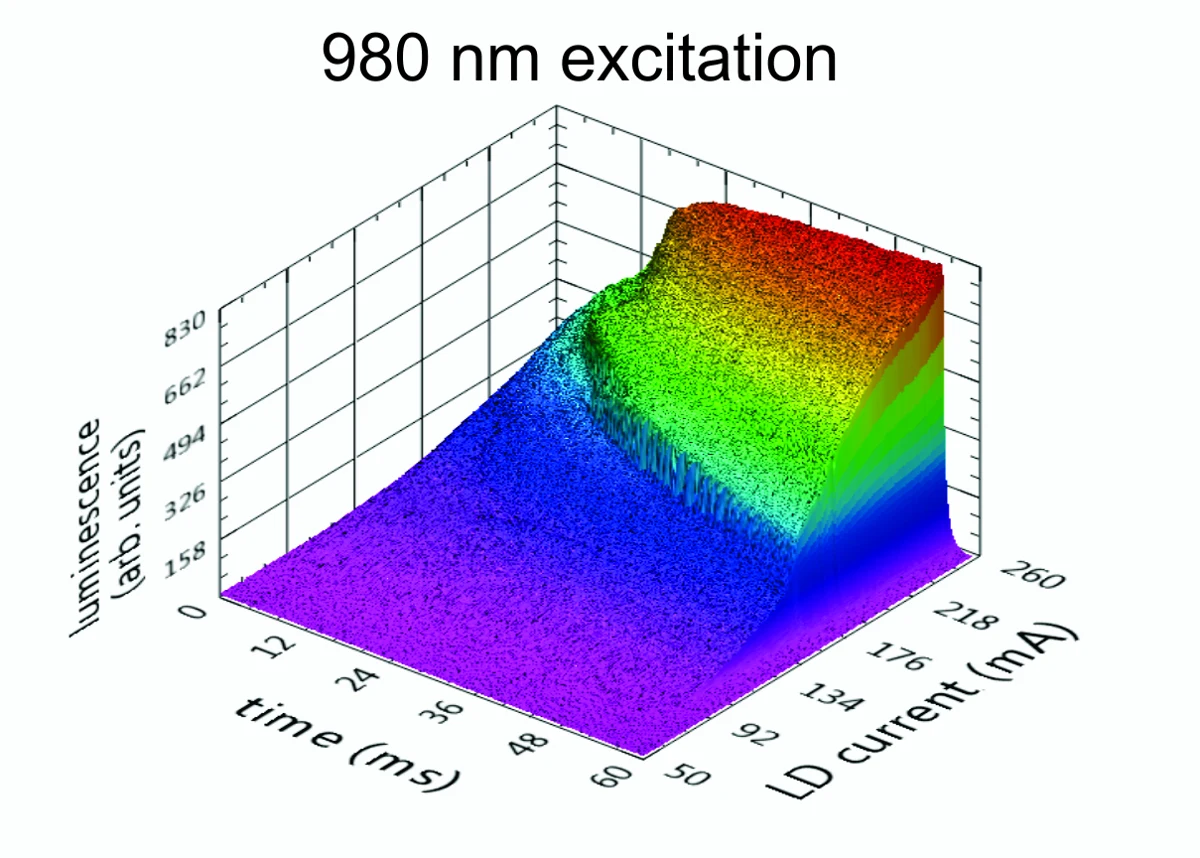
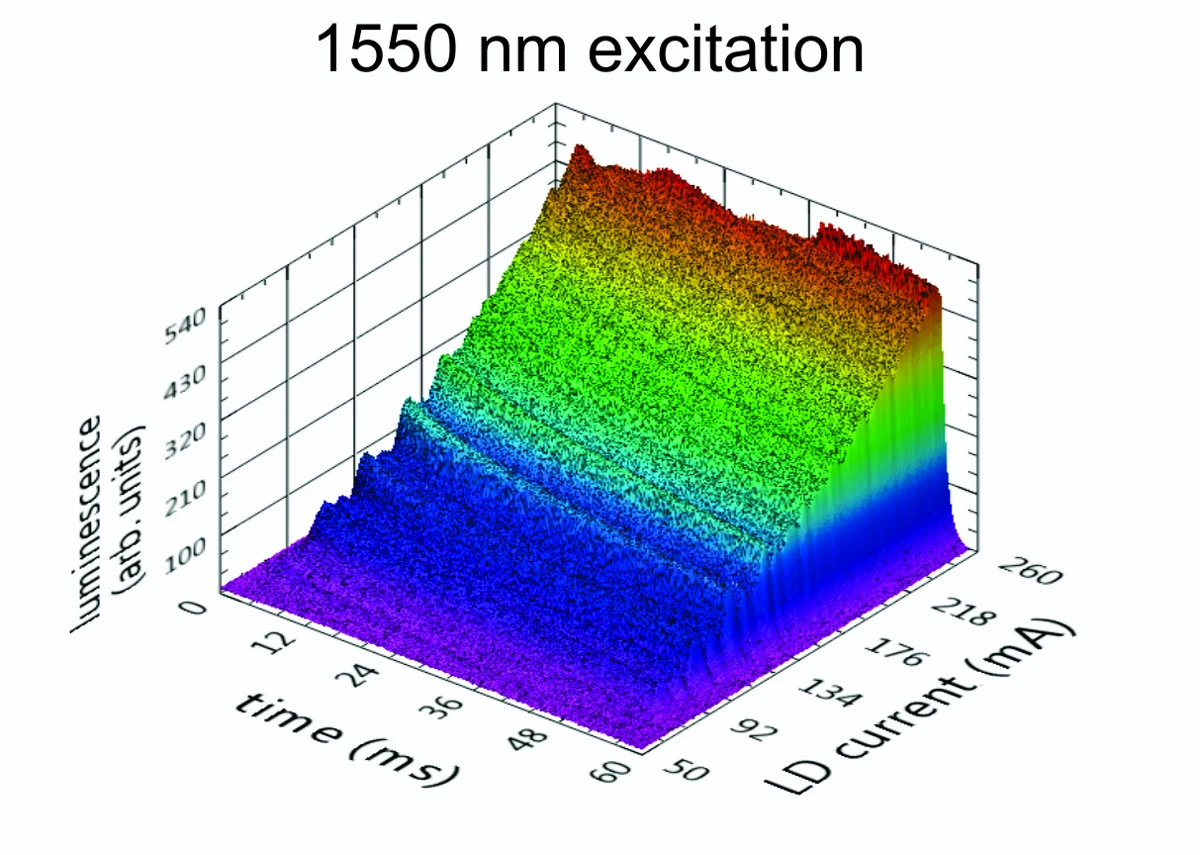
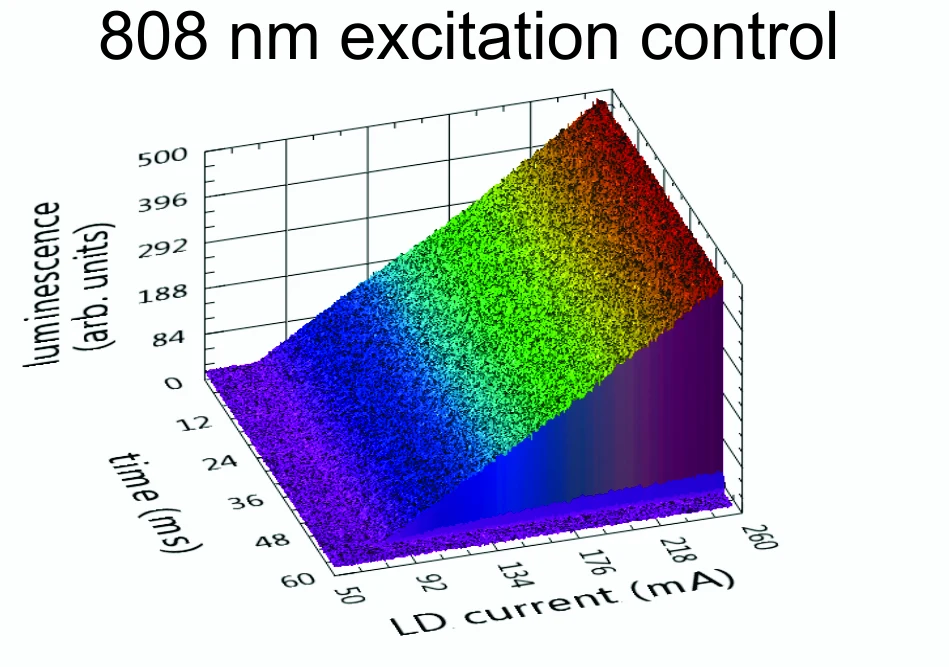
The same crystal answers 808, 980 and 1550 nm light, and each wavelength leaves a different shape of response as power rises. That is the kind of fingerprint an IMS reader is built to check.
Heat a rare-earth phosphor and its light changes in a predictable way. In this IMS thermal-phosphor project the blue band near 455 nm grows steadily against the peak at 493 nm, from room temperature all the way to 1,100 °C. The ratio between the two is the temperature, read by light alone: no wires, no contact, through a window or into a flame.

Y₂O₂S:Yb,Er and La₂O₂S:Yb,Er were set into flexible silicone (PDMS) films and read with a 980 nm laser from −50 to +200 °C. Brightness, rise time and decay time all tracked temperature, making a thin, bendable, reusable temperature sensor. It is the same rise-and-decay clock we use to code a crystal.
Read the paper ↗In March 1971, P. N. Yocom, J. P. Wittke and I. Ladany of RCA Laboratories in Princeton reported that rare-earth oxysulfides, La₂O₂S, Gd₂O₂S and Y₂O₂S, efficiently turn the infrared light of a gallium-arsenide diode into visible green (ytterbium and erbium) or blue (ytterbium and thulium). IMS works today in the same RCA / Sarnoff building, and the crystal on this page belongs to the same family.
Intelligent Material crystals are inert, inorganic solids, used at tiny loadings inside inks, plastics, fibers and adhesives. Safety Data Sheets (SDS) and Technical Data Sheets (TDS) are available on request under a non-disclosure agreement.
We share full data sets and samples with research and industry partners under NDA. Tell us what you would like to measure.
 ISO 9001:2015 CertifiedQuality management system · SGS certificate US23/00000276 · valid to June 2029